End-to-End Data Pipeline & Dashboard Using Azure for E-commerce Industry
Note: This is an AI-generated image and not an actual dashboard.
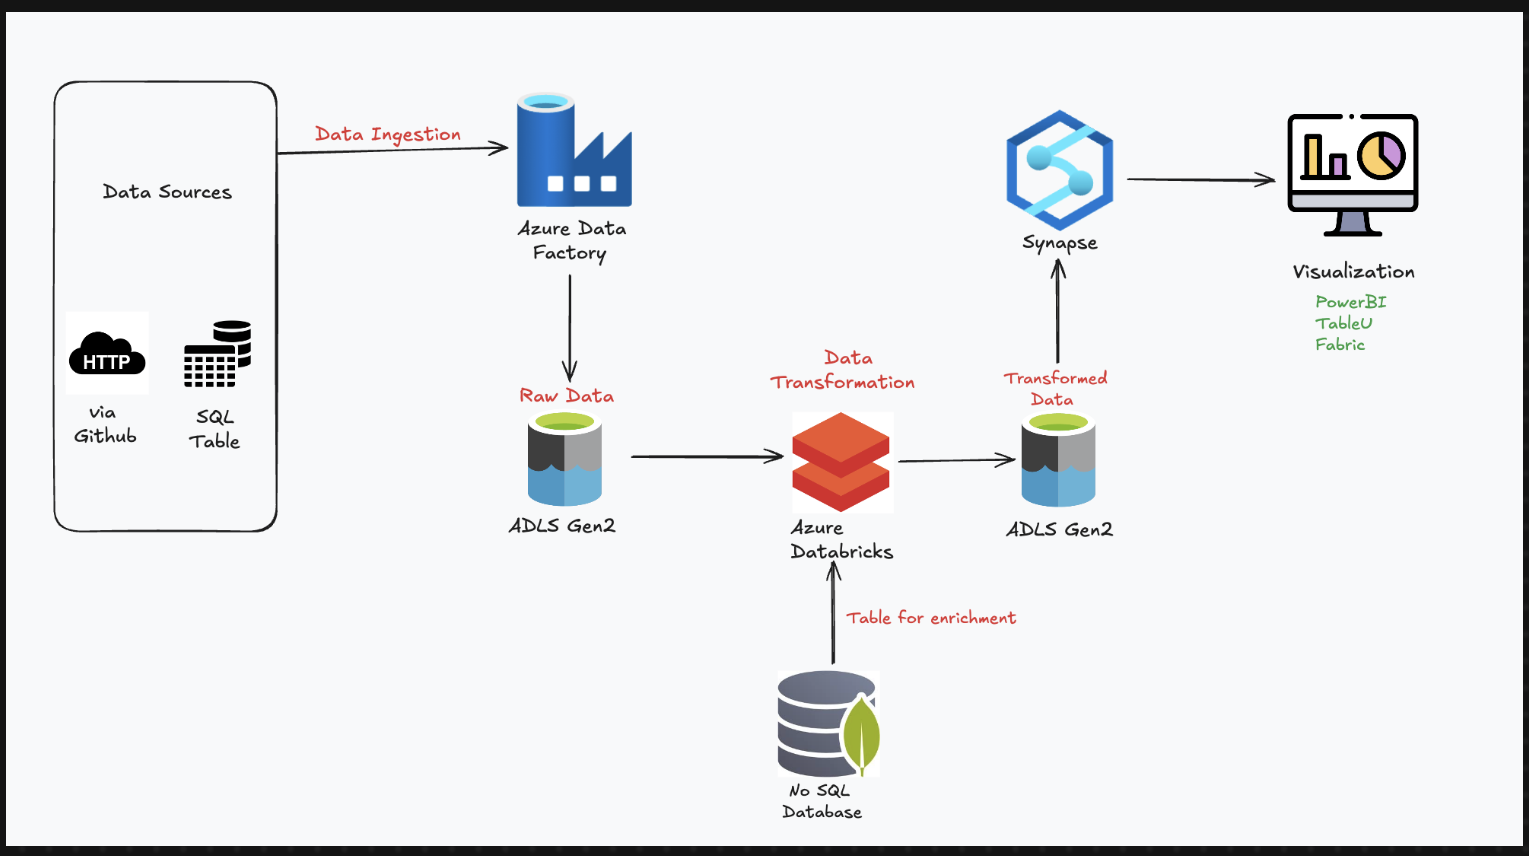
The aim of this project was to build an end-to-end Azure-based data pipeline and Power BI dashboard for an E-commerce company to centralize and analyze data from SQL, NoSQL (MongoDB), and CSV sources. Using Azure Data Factory, data was ingested and stored in a structured ADLS Gen2 bronze layer, enriched and transformed with Azure Databricks into a silver layer, and refined with Azure Synapse into a gold layer. The final data was visualized in Power BI, providing the business with a reliable, automated, and interactive reporting solution for better decision-making across sales and operations.
Project Summary Table
👉 Scroll left/right to view the full table
| Industry | Technology Used | Problem Statement | Solution | Impact |
|---|---|---|---|---|
| E-commerce | Azure Data Factory (ADF), Azure Data Lake Storage Gen2 (ADLS), Azure Databricks, Spark (PySpark), Azure Synapse, Power BI | Multiple and disconnected data sources made reporting and data analysis time-consuming and inconsistent. | Created an automated data pipeline using ADF to bring CSV and SQL data into ADLS Gen2 (Bronze layer). | Centralized and automated data ingestion from all key data sources. |
| Needed to combine structured (SQL/CSV) and semi-structured (NoSQL) data. | Used Databricks to enrich and transform the data from all sources (including MongoDB) and stored it in ADLS Silver layer. | Unified and clean data for further analysis and reporting. | ||
| Data transformations were manual and not scalable. | Applied transformations and enrichment using Spark Python scripts to automate the process. | Improved scalability and consistency in data preparation. | ||
| Business users had difficulty accessing and understanding raw data. | Used Synapse SQL scripts to filter and prepare the data for reporting (Gold layer). | Business-friendly, clean dataset ready for reporting. | ||
| Lack of visual reports for decision-making. | Connected Power BI to the Gold layer and created insightful dashboards. | Enabled business teams to make data-driven decisions with visual and interactive dashboards. |
Step-by-Step Process
1. Data Collection (Bronze Layer)
I used Azure Data Factory (ADF) to collect data from CSV files and SQL databases. I built a pipeline using Lookup and ForEach activities to loop through the files and fetch the data. All the raw data was stored in the Bronze folder inside ADLS Gen2 (Azure Data Lake Storage).
2. Data Enrichment and Transformation (Silver Layer)
I used Azure Databricks to read the bronze data. I also pulled data from NoSQL (MongoDB) and merged it with the existing data. Then I cleaned, transformed, and enriched the data using Spark (Python). The refined data was saved in the Silver folder in Parquet format.
3. Data Filtering and View Creation (Gold Layer)
I used Azure Synapse Analytics to read the silver data and applied SQL filters to prepare final views. These filtered datasets were stored in the Gold folder in ADLS Gen2, ready for reporting.
4. Dashboard Creation in Power BI
I connected Power BI to the Gold layer data and built an interactive dashboard to help the business team track performance and make better decisions.
Overall Impact
This project helped the E-commerce company automate their full data process — from collection to dashboard. Now, the team has clean, reliable, and up-to-date data that’s easy to understand and use for daily decision-making.