Handling Custom Data Transformations: Adding Cumulative Net Cash Flow in Power BI
Data often comes in a structured format, but business requirements may necessitate adding new rows or performing specific calculations to derive additional insights. One such scenario arises in financial data reporting, where a client might request a "Cumulative Net Cash Flow" category based on existing "Net Cash Flow" values.
Understanding the Requirement
Our dataset consists of columns such as Category, Sub Category, Segment, Date, Value, and Year. The goal is to compute a "Cumulative Net Cash Flow" sub-category based on the existing "Net Cash Flow" values.
Example Data
| Date | Sub Category | Value |
|---|---|---|
| 31/03/2020 | Net Cash Flow | 100 |
| 30/06/2020 | Net Cash Flow | 150 |
| 30/09/2020 | Net Cash Flow | 200 |
| 31/12/2020 | Net Cash Flow | 250 |
Expected Output:
| Date | Sub Category | Value |
|---|---|---|
| 31/03/2020 | Cumulative Net Cash Flow | 100 |
| 30/06/2020 | Cumulative Net Cash Flow | 250 |
| 30/09/2020 | Cumulative Net Cash Flow | 350 |
| 31/12/2020 | Cumulative Net Cash Flow | 450 |
Step 3. Expanding Investment Data
The following DAX code expands the Investment Data by adding a cumulative net cash flow calculation. This ensures that we sum up values over time while maintaining proper filtering by category, segment, and date.
Investmentdata_Expanded =VAR Cumulativenetcashflow = ADDCOLUMNS( FILTER(Investmentdata, Investmentdata[Sub Category] = "Net Cash Flow"), "Cumulative Value", VAR currentcategory = Investmentdata[Category] VAR currentsegment = Investmentdata[Segment] VAR curretdate = Investmentdata[Date] RETURN SUMX( TOPN(2, FILTER( ALL(Investmentdata), Investmentdata[Category] = currentcategory && Investmentdata[Segment] = currentsegment && Investmentdata[Segment] = "Net Cash Flow" && Investmentdata[Date] <= curretdate ), Investmentdata[Date], DESC ), Investmentdata[Value] ) )VAR cumulativeformated = SELECTCOLUMNS( Cumulativenetcashflow, "Category" , Investmentdata[Category], "Date", Investmentdata[Date], "Segment", Investmentdata[Segment], "Sub Category", "Cumulative Net Cash Flow", "Value", [Cumulative Value], "Year", Investmentdata[Year] )RETURN UNION( SELECTCOLUMNS(Investmentdata, "Category" , [Category], "Date", [Date], "Segment", [Segment], "Sub Category", [Sub Category], "Value", [Value], "Year", [Year] ), cumulativeformated )
This DAX formula calculates the cumulative net cash flow by summing up the values for the current and previous time periods. It ensures that financial trends are properly analyzed over time.
Explanation of DAX Code
- Filters Net Cash Flow data.
- Calculates cumulative values using
SUMXover previous periods. - Formats the new row with the sub-category "Cumulative Net Cash Flow".
- Uses
UNIONto combine the original dataset with the new cumulative values.
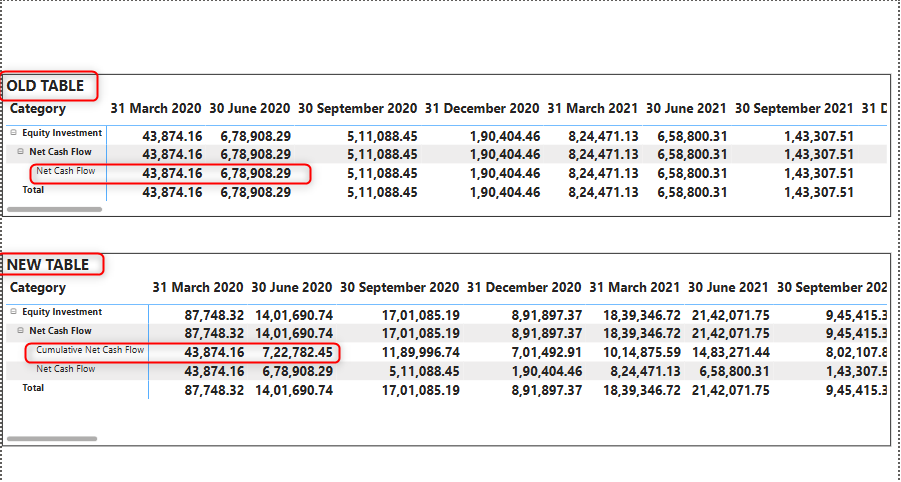
Conclusion
This approach allows for dynamic calculation and integration of a new sub-category into the existing dataset. It ensures that the "Cumulative Net Cash Flow" updates automatically as new data is added, providing a seamless reporting experience for the client. This technique can be extended to other similar cumulative calculations in financial and business reporting.