Financial Services Dashboard Optimization with Power BI
Note: This is an AI-generated image and not an actual dashboard.
The aim of this project was to enhance the financial reporting process for a Financial Services client by developing a dynamic Power BI dashboard that incorporates multiple data sources and allows for real-time adjustments. The solution aimed to streamline financial analysis, enabling the client to interactively forecast, analyze P&L, and compare actuals versus budget in a user-friendly format. By leveraging field parameters, dynamic measures, and interactive slicers, the project delivered a robust, responsive tool that significantly improved reporting efficiency and accuracy, empowering decision-makers to make data-driven business decisions.
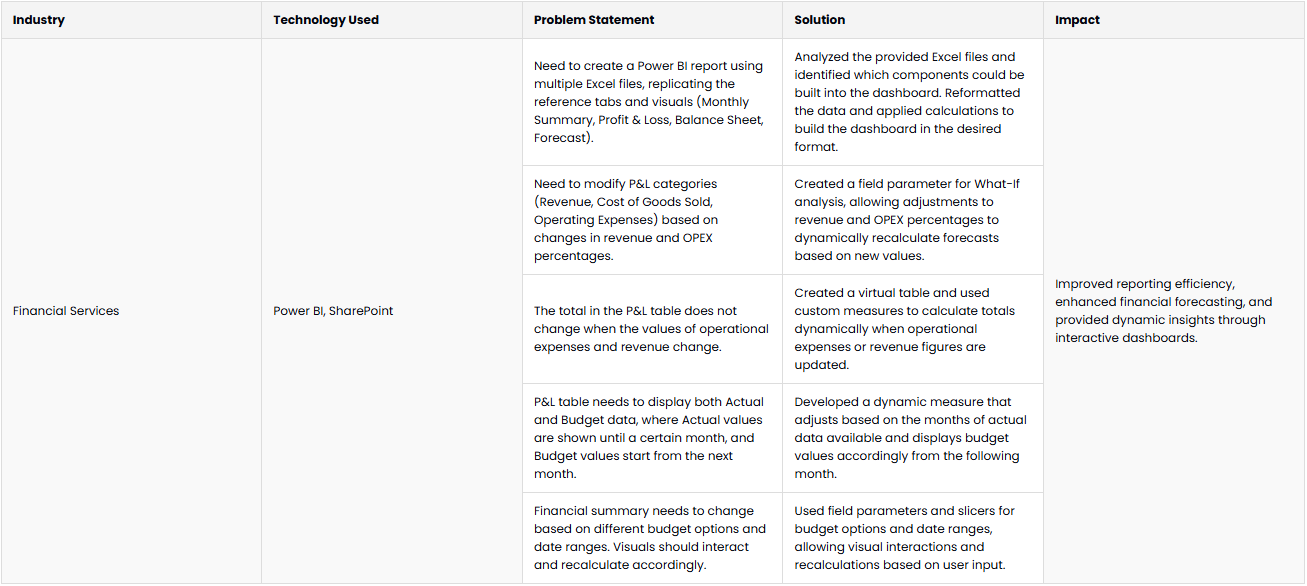
| Industry | Technology Used | Problem Statement | Solution | Impact |
|---|---|---|---|---|
| Financial Services | Power BI, SharePoint | Need to create a Power BI report using multiple Excel files, replicating the reference tabs and visuals (Monthly Summary, Profit & Loss, Balance Sheet, Forecast). | Analyzed the provided Excel files and identified which components could be built into the dashboard. Reformatted the data and applied calculations to build the dashboard in the desired format. | Improved reporting efficiency, enhanced financial forecasting, and provided dynamic insights through interactive dashboards. |
| Need to modify P&L categories (Revenue, Cost of Goods Sold, Operating Expenses) based on changes in revenue and OPEX percentages. | Created a field parameter for What-If analysis, allowing adjustments to revenue and OPEX percentages to dynamically recalculate forecasts based on new values. | |||
| The total in the P&L table does not change when the values of operational expenses and revenue change. | Created a virtual table and used custom measures to calculate totals dynamically when operational expenses or revenue figures are updated. | |||
| P&L table needs to display both Actual and Budget data, where Actual values are shown until a certain month, and Budget values start from the next month. | Developed a dynamic measure that adjusts based on the months of actual data available and displays budget values accordingly from the following month. | |||
| Financial summary needs to change based on different budget options and date ranges. Visuals should interact and recalculate accordingly. | Used field parameters and slicers for budget options and date ranges, allowing visual interactions and recalculations based on user input. |